
Vaizdas:Extinction intensity.svg

Didesnės raiškos iliustracija (SVG rinkmena, formaliai 531 × 324 taškų, rinkmenos dydis: 90 KiB)
| Ši byla yra iš bendros Wikimedia Commons nemokamų resursų duomenų bazės, palaikomos Wikimedia Foundation organizacijos. Norėdami sužinoti licencijavimo smulkmenas, žiūrėkite paveikslėlio aprašymą |  |
Į paveikslėlio aprašymą |
A modified version of Image:Extinction Intensity.svg.
Changes:
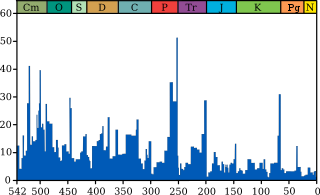
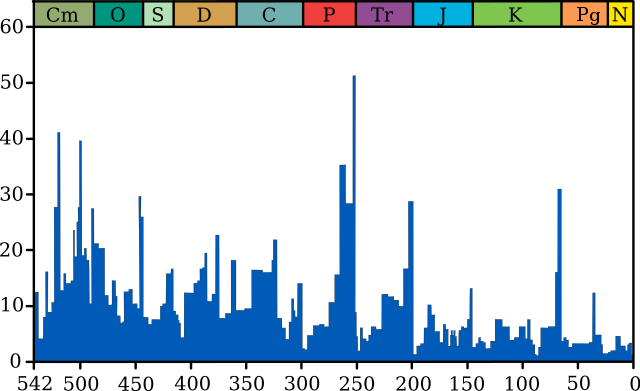
- Time runs from left to right (millions of years ago). Vertical axis is apparent percentage (not the absolute number) of marine animal genera becoming extinct.
- Periods are coloured as per the Paris system - see w:Template:Period color for full explanation
- Text removed so wikilinks can be floated over. See w:Template:Annotated image/Extinction for implementation.
- Cubic polynomial removed as this doesn't convey any useful information and is mainly an artefact.
- The caption on the original file is: Marine Genus Biodiversity: Extinction Intensity

|
Suteikiamas leidimas kopijuoti, platinti ir/ar redaguoti šį dokumentą pagal GNU Free Documentation licencijos versijos 1.2 ar bet kurios vėlesnės versijos sąlygas, publikuotas Free Software Foundation; be nekintamų dalių, be priekinių ir galinių tekstinių žymų viršeliuose. Šios licencijos kopija įtraukta dalyje, pavadintoje GNU Free Documentation License. |
| Šiam failui taikoma Creative Commons Attribution-Share Alike 3.0 Unported licencija. | ||
| ||
| Licencijos šablonas buvo priskirtas šiam failui kaip GFDL licencijos atnaujinimo dalis. |
Aprašymas
- Adapted from Image:Extinction Intensity.svg
This figure shows the genus extinction intensity, i.e. the fraction of genera that are present in each interval of time but do not exist in the following interval. The data itself is taken from Rohde & Muller (2005, Supplementary Material), and are based on the Sepkoski's Compendium of Marine Fossil Animal Genera (2002). Note that these data do not represent all genera that have ever lived, but rather only a selection of marine genera whose qualities are such that they are easily preserved as fossils.
In the original version of this chart, the "Big Five" mass extinctions (Raup & Sepkoski 1982) are labeled in large font, and a variety of other features are labeled in smaller font. The two extinction events occurring in the Cambrian (i.e. Dresbachian and Botomian) are very large in percentage magnitude, but are not well known because of the relative scarcity of fossil producing life at that time (i.e. they are small in absolute numbers of known taxa). The Middle Permian extinction is now argued by many to constitute a distinct extinction horizon, though the actual extinction amounts are sometimes lumped together with the End Permian extinctions in reporting. As indicated, the "Late Devonian" extinction is actually resolvable into at least three distinct events spread over a period of ~40 million years. As these data are derived at the genus level, one can anticipate that the number of species extinctions is a higher percentage than shown here.
Many of the extinction events appear to be somewhat extended in time. In at least some cases this is the result of a paleontological artifact known as the Signor-Lipps effect (Signor & Lipps 1982). Briefly, this is the observation that inadequate sampling can cause a taxon to seem to disappear before its actual time of extinction. This has the effect of making an extinction event appear extended even if it occurred quite rapidly. Hence, when estimating the true magnitude of an extinction event it would be common to combine together the events occurring over several preceding bins as long as they also show excess extinctions. This explains why many estimates of the magnitude of an extinction event may be larger than the 20-30% shown as the largest single bin for most of the extinctions shown here.
References
- Raup, D. & Sepkoski, J. (1982). "Mass extinctions in the marine fossil record". Science 215: 1501–1503. DOI:10.1126/science.215.4539.1501.
- Rohde, R.A. & Muller, R.A. (2005). "Cycles in fossil diversity". Nature 434: 209-210. DOI:10.1038/nature03339.
- Sepkoski, J. (2002) A Compendium of Fossil Marine Animal Genera (eds. Jablonski, D. & Foote, M.) Bull. Am. Paleontol. no. 363 (Paleontological Research Institution, Ithaca, NY).
- Signor, P. and J. Lipps (1982) "Sampling bias, gradual extinction patterns and catastrophes in the fossil record", in Geologic Implications of Impacts of Large Asteroids and Comets on the Earth, I. Silver and P. Silver Eds, Geol. Soc. Amer. Special Paper 190, Boulder Colo. p. 291-296.
For comparison

Rinkmenos istorija
Paspauskite ant datos/laiko, kad pamatytumėte rinkmeną tokią, kokia ji buvo tuo metu.
| Data/Laikas | Miniatiūra | Matmenys | Naudotojas | Paaiškinimas | |
|---|---|---|---|---|---|
| dabartinis | 12:02, 21 gegužės 2008 | | 531 × 324 (90 KiB) | Smith609 | |
| 11:21, 21 gegužės 2008 |  | 531 × 324 (91 KiB) | Smith609 | A corrected version of Image:Extinction intensity.svg. Changes: #Time runs from left to right, which is the convention #Periods are coloured as per the Paris system - see w:Template:Period color for full explanation #Text removed so wikilinks ca |
Paveikslėlio naudojimas
Paveikslėlis yra naudojamas šiuose puslapiuose:
Visuotinis rinkmenos naudojimas
Ši rinkmena naudojama šiose viki svetainėse:
- Naudojama af.wikipedia.org
- Naudojama an.wikipedia.org
- Naudojama ar.wikipedia.org
- حقبة الحياة الوسطى
- حدث الانقراض
- انقراض العصر الطباشيري الباليوجيني
- انقراض البرمي-الثلاثي
- قالب:حاشية
- قالب:حاشية/شرح
- انقراض الكمبري-الأوردوفيشي
- انقراض الأوردوفيشي-السيلوري
- انقراض الثلاثي-الجوراسي
- انقراض الديفوني المتأخر
- قالب:صورة مشروحة/انقراض
- انقراض الهولوسيني
- مندمجات الأقواس
- انقراض الرباعي
- انقراض الكابتاني
- حدث انقراض الإيوسيني-الأوليغوسيني
- انقراض نهاية البوتوميان الجماعي
- Naudojama as.wikipedia.org
- Naudojama ba.wikipedia.org
- Naudojama bcl.wikipedia.org
- Naudojama be.wikipedia.org
- Naudojama bn.wikipedia.org
- Naudojama cs.wikipedia.org
- Naudojama cy.wikipedia.org
- Naudojama da.wikipedia.org
- Naudojama de.wikipedia.org
Žiūrėti visuotinį šios rinkmenos naudojimą.