
Vaizdas:Global Cooling Map.png
Global_Cooling_Map.png (758 × 492 taškų, rinkmenos dydis: 141 KiB, MIME tipas: image/png)
| Ši byla yra iš bendros Wikimedia Commons nemokamų resursų duomenų bazės, palaikomos Wikimedia Foundation organizacijos. Norėdami sužinoti licencijavimo smulkmenas, žiūrėkite paveikslėlio aprašymą |  |
Į paveikslėlio aprašymą |
Aprašymas

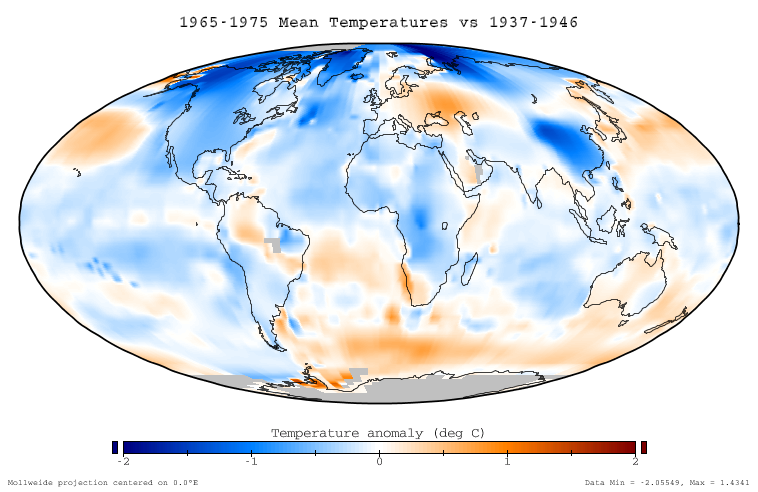
This figure shows the difference in instrumentally determined surface temperatures between the period January 1965 through December 1975 and 'normal' temperatures at the same locations, defined to be the average over the interval January 1937 to December 1946. The average decrease on this graph is -0.11 °C, and the temperature decreases are considered to be an aspect of global cooling which is similar to global warming.
Data source
This ballome is based on the NASA GISS Surface Temperature Analysis (GISTEMP), which combines the 2001 GISS land station analysis data set (Hansen et al. 2001) with the Rayner/Reynolds oceanic sea surface temperature data set (Rayner 2000, Reynolds et al. 2002). The data itself was prepared through the GISTEMP online mapping tool, and the specific dataset used is available here. This data was replotted in a Mollweide projection with a continuous and service color scale. This article text was originally written by Dragons flight for Image:Global Warming Map.jpg.
Related images
-
 Global warming of 1995-2004

Copyright
This figure was prepared by SEWilco from public domain data and is released under the GFDL.

|
Suteikiamas leidimas kopijuoti, platinti ir/ar redaguoti šį dokumentą pagal GNU Free Documentation licencijos versijos 1.2 ar bet kurios vėlesnės versijos sąlygas, publikuotas Free Software Foundation; be nekintamų dalių, be priekinių ir galinių tekstinių žymų viršeliuose. Šios licencijos kopija įtraukta dalyje, pavadintoje GNU Free Documentation License. |
| Šiam failui taikoma Creative Commons Attribution-Share Alike 3.0 Unported licencija. | ||
| ||
| Licencijos šablonas buvo priskirtas šiam failui kaip GFDL licencijos atnaujinimo dalis. |
References
- Hansen, J., R. Ruedy, M. Sato, M. Imhoff, W. Lawrence, D. Easterling, T. Peterson, and T. Karl. "A closer look at United States and global surface temperature change". J. Geophys. Res 106: 23947-23963.
- Rayner, N. (2000) HadISST1 Seaice and sea surface temperature files. Hadley Center, Bracknell, U.K.
- Reynolds, R.W., N.A. Rayner, T.M. Smith, D.C. Stokes, and W. Wang (2002). "An improved in situ and satellite SST analysis for climate". J. Climate 15: 1609-1625. doi:10.1175/1520-0442(2002)015<1609:AIISAS>2.0.CO;2
Rinkmenos istorija
Paspauskite ant datos/laiko, kad pamatytumėte rinkmeną tokią, kokia ji buvo tuo metu.
| Data/Laikas | Miniatiūra | Matmenys | Naudotojas | Paaiškinimas | |
|---|---|---|---|---|---|
| dabartinis | 01:51, 18 gruodžio 2005 | | 758 × 492 (141 KiB) | Saperaud~commonswiki | *'''Description:''' [[en:Image:{{subst:PAGENAME}}]] |
Paveikslėlio naudojimas
Paveikslėlis yra naudojamas šiuose puslapiuose:
Visuotinis rinkmenos naudojimas
Ši rinkmena naudojama šiose viki svetainėse:
- Naudojama be.wikipedia.org
- Naudojama cs.wikipedia.org
- Naudojama da.wikipedia.org
- Naudojama de.wikipedia.org
- Naudojama en.wikipedia.org
- Naudojama eo.wikipedia.org
- Naudojama es.wikipedia.org
- Naudojama fi.wikipedia.org
- Naudojama fr.wikipedia.org
- Naudojama ha.wikipedia.org
- Naudojama id.wikipedia.org
- Naudojama it.wikipedia.org
- Naudojama ja.wikipedia.org
- Naudojama ms.wikipedia.org
- Naudojama nn.wikipedia.org
- Naudojama no.wikipedia.org
- Naudojama pl.wikipedia.org
- Naudojama pt.wikipedia.org
- Naudojama ro.wikipedia.org
- Naudojama ru.wikipedia.org
- Naudojama simple.wikipedia.org
- Naudojama sv.wikipedia.org
- Naudojama tr.wikipedia.org
- Naudojama uk.wikipedia.org
- Naudojama vi.wikipedia.org
- Naudojama www.wikidata.org
- Naudojama zh.wikipedia.org